v1.0.0 Stable
Admin Dashboard
The dashboard provides an immediate 360-degree view of your event platform's health, including user growth, financial metrics, and global activity.
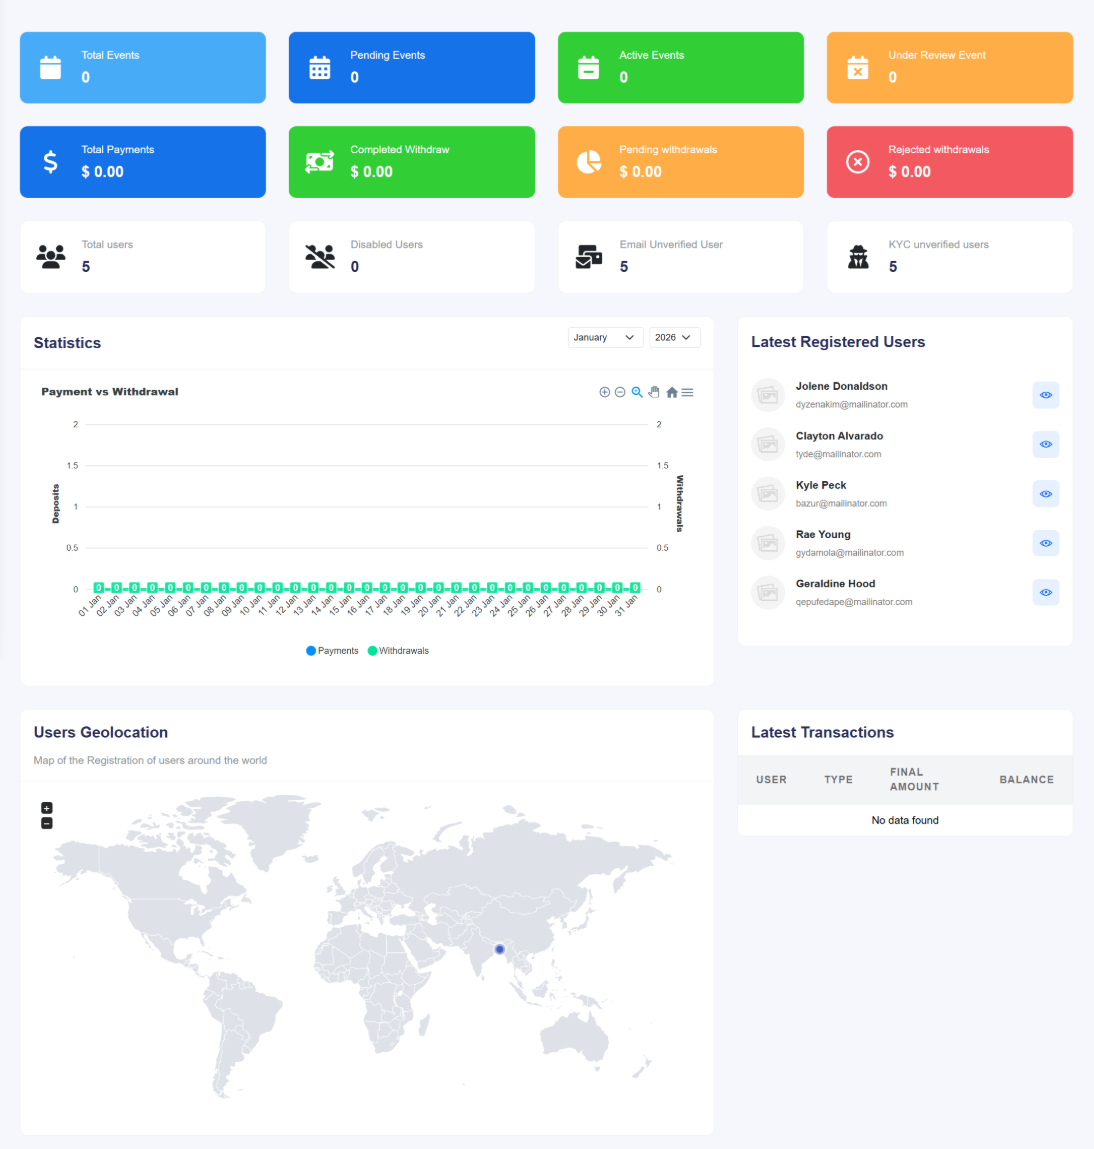
Figure 1.0: The primary administrative dashboard interface.
1. Key Metric Counters
The top row of the dashboard features high-level summaries categorized into three primary sectors:
- Event Statistics: Tracks Total Events, Pending Events (awaiting approval), Active Events, and Under Review Events. This helps admins manage the content queue effectively.
- Financial Overview: Displays Total Payments alongside withdrawal statuses including Completed, Pending, and Rejected Withdrawals. All amounts are localized to your base currency.
- User Base: Provides counts for Total Users, Disabled Users, and verification statuses such as Email Unverified and KYC Unverified users.
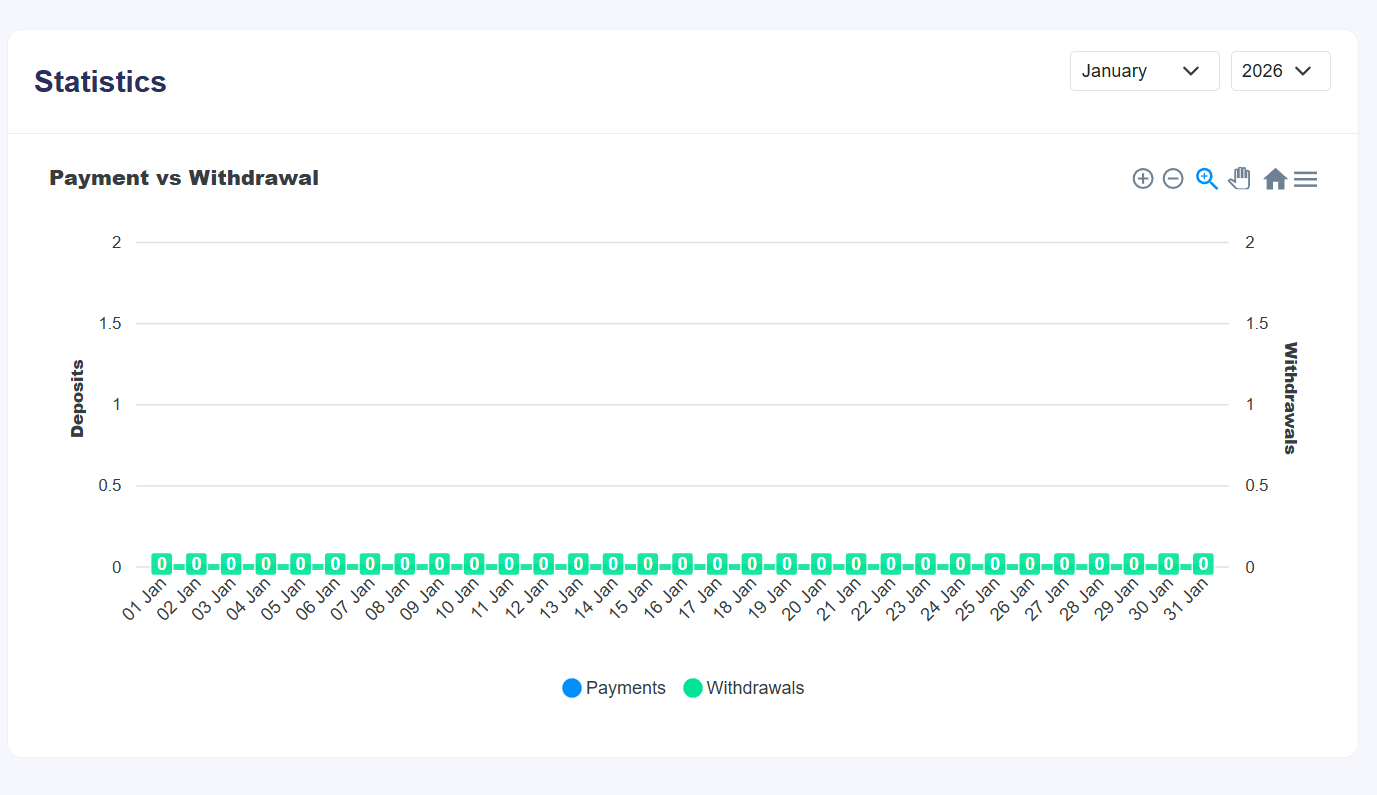
2. Payment vs. Withdrawal Analytics
This interactive line chart provides a daily comparison of cash flow. By toggling specific months and years, you can track seasonal trends in ticket sales versus organizer payouts.
3. User Geolocation & Activity
The bottom section of the dashboard focuses on user engagement and platform security:
- Users Geolocation: An interactive world map visualizing where your registrants are located, assisting in targeted marketing and regional event planning.
- Latest Registered Users: A real-time feed of the newest accounts, displaying names, email addresses, and quick-action view buttons.
- Latest Transactions: A summary table showing the most recent financial movements, including user ID, transaction type, final amounts, and post-transaction balances.